
Why Five-Star Averages Are a Poor Proxy for Product Quality
Rating distributions, review volume, and recency bias all distort star averages. Learn to read review data more accurately than the headline score.
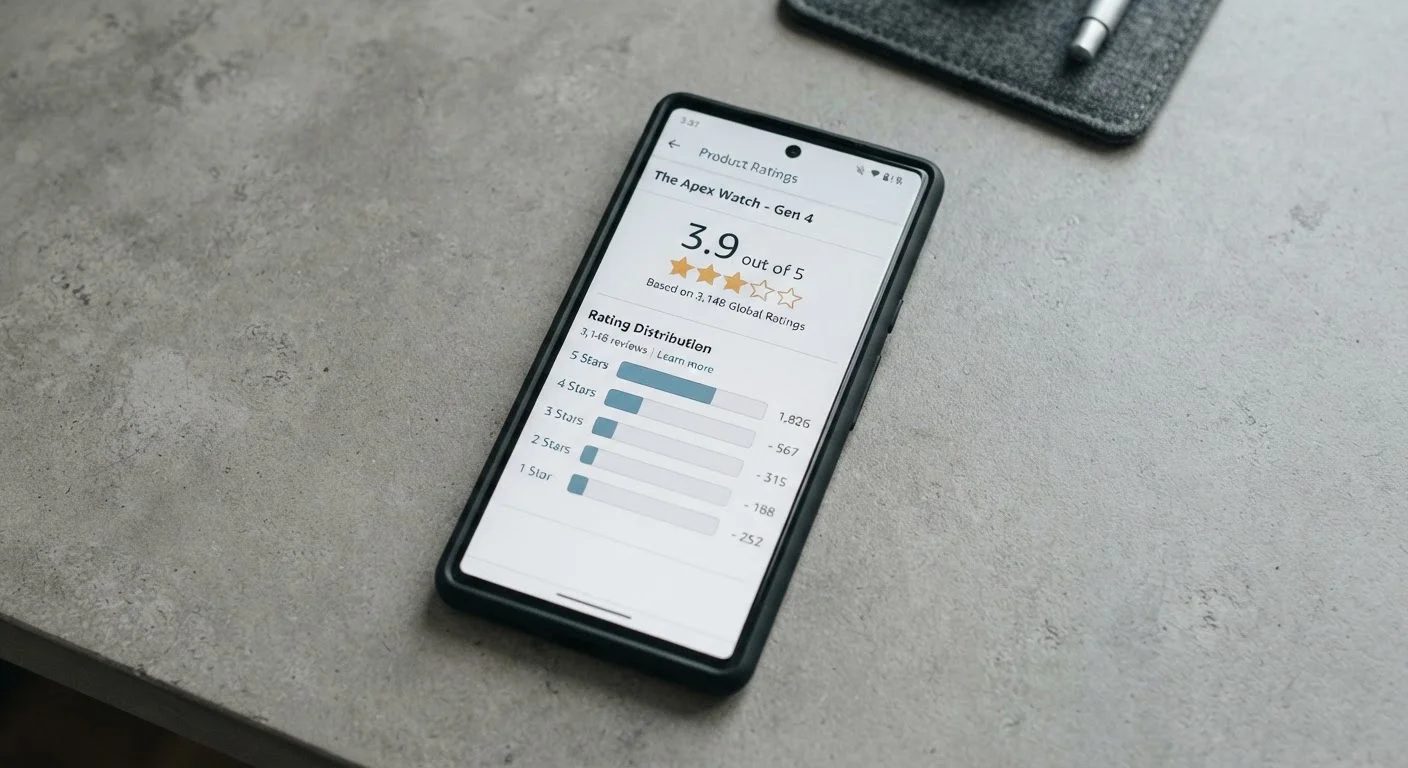
Photo: SummarizedReads.net | Just Read It! editorial
—— In This Article
Key Takeaways
- A high average star rating can mask a deeply polarized or shrinking review base.
- Review volume, recency, and distribution shape reliability far more than the headline number.
- Incentivized and fake reviews systematically inflate averages on major retail platforms.
- Reading the lowest-rated reviews often reveals the most predictive quality signals.
- Products with fewer but consistent ratings frequently outperform high-volume, inflated scores.
The Number Everyone Trusts—and Why That's a Problem
When shoppers scan search results or product pages, the star average is almost always the first quality signal they reach for. It's fast, familiar, and feels objective. The problem is that a single averaged number compresses an enormous amount of conflicting information into a figure that can be actively misleading.
Consider two products, both rated 4.2 out of 5. One has 80% four- and five-star reviews and a small cluster of one-stars from outlier experiences. The other has a nearly even spread across all star levels—a classic bimodal distribution where half of buyers love the product and half regret it. The average is identical. The purchase risk is not.
Understanding why averages fail—and what to look at instead—is one of the most transferable skills in smarter shopping. The myth-versus-fact pairs below address the most common misreads, and the hidden variables that distort product comparisons article covers related factors that rarely appear in headline scores.
Myth
A product with a 4.5-star average is reliably better than one rated 4.1 stars.
Fact
Small differences in star averages are rarely statistically meaningful, especially across different review volumes and time spans.
Averaging across hundreds or thousands of responses compresses genuine quality signals. A 4.5 from 30 reviews carries far more statistical uncertainty than a 4.1 from 2,000 reviews. Platforms also apply different weighting algorithms—some penalize older reviews, others weight verified purchases differently—so raw averages across platforms are not directly comparable. Treat differences smaller than roughly 0.3–0.5 stars as noise unless the sample sizes are large and similar.
Myth
More reviews always means a more trustworthy rating.
Fact
High review volume can reflect aggressive incentive programs or review manipulation as much as genuine buyer satisfaction.
Research from academic institutions studying e-commerce platforms has documented that products sold through fulfilled-by-marketplace models often accumulate reviews through post-purchase email campaigns, discount-for-review schemes, and coordinated third-party review services. A product with 15,000 reviews that launched with promotional giveaways may have a structurally inflated baseline. Volume is a necessary but insufficient condition for trustworthiness—it must be paired with distribution analysis and recency checks.
Myth
The star average reflects all buyers' experiences equally.
Fact
Highly satisfied and highly dissatisfied buyers are disproportionately likely to leave reviews, creating systematic selection bias.
Research in behavioral economics consistently finds that extreme experiences—very positive or very negative—motivate review-writing far more than moderate satisfaction does. This means the large middle of the buyer population, those who found the product acceptable but unremarkable, is chronically underrepresented. The result is an average pulled toward the extremes of the actual distribution, not a clean reflection of typical experience. Products that perform solidly but unspectacularly are routinely underrated relative to their real-world utility.
Myth
A product that has maintained a high rating for several years is consistently good.
Fact
Manufacturers frequently change components, materials, or suppliers over a product's life cycle without updating the listing or model number.
This practice—sometimes called a silent revision—means that the five-star reviews from three years ago may describe a fundamentally different product than what ships today. It's particularly common in consumer electronics accessories, kitchen appliances, and outdoor gear. Checking the review dates and reading the most recent batch independently of the historical average is the only reliable way to detect a quality drift. Some review analysis tools and browser extensions surface this trend data automatically.
Myth
Negative reviews are just from difficult customers and can be safely ignored.
Fact
Recurring themes in low-star reviews often identify real, reproducible product defects that affect a predictable percentage of buyers.
While individual negative reviews sometimes reflect mismatched expectations, a cluster of one- and two-star reviews citing the same failure mode—a hinge that breaks after 90 days, a seal that leaks under moderate pressure, a battery that degrades rapidly—represents genuine quality data. The signal-to-noise ratio in negative reviews improves substantially when you filter for verified purchases and look for language overlap across multiple reviewers. One mention of a flaw is anecdote; five independent mentions is a pattern worth weighing in your decision.
What the Data Behind the Stars Actually Tells You
Once you move past the headline number, the review dataset becomes genuinely informative. A few practical habits shift the way you read any product listing.
Check the distribution histogram first. Most major retail platforms display a bar chart breaking reviews into each star tier. A healthy product typically shows a heavy right skew—lots of fives and fours, a small one-star tail. A bimodal distribution (peaks at both five and one) signals a divisive product that may perform very well for one use case and poorly for another. Neither pattern is captured by the average.
Sort reviews by recency and look for trend breaks. A product that earned 4.6 stars over three years but has averaged 3.1 stars in the past six months has probably declined in manufacturing quality, has been superseded by a newer version, or has attracted a new customer segment with different expectations. Platforms don't always surface this shift automatically.
Read the one- and two-star reviews selectively, not emotionally. Dismiss reviews that complain about shipping damage or retailer packaging—those rarely reflect the product itself. Focus on recurring themes: failure after a specific time period, a design flaw mentioned by multiple reviewers, or poor compatibility with a common setup. Patterns in negative reviews are statistically more predictive than isolated praise.
~42%
Estimated fake or incentivized reviews on major platforms
A 2023 analysis by the consumer advocacy organization Which? examined major retail platforms and estimated that a substantial share of reviews showed markers associated with manipulation, including clustering, unnatural posting patterns, and verified incentives.
4.3
Average star rating shoppers consider trustworthy
Consumer survey data from the Spiegel Research Center indicates that ratings around 4.0–4.7 tend to generate the highest purchase conversion, while perfect 5.0 scores are increasingly viewed with suspicion by experienced online shoppers.
18%
Buyers who leave reviews after a neutral experience
Studies of online review behavior suggest that neutral-to-satisfied buyers leave reviews at substantially lower rates than highly positive or highly negative buyers, contributing to structural skew in published averages.
For a structured approach when no existing review site matches your exact situation, the guide on building your own side-by-side comparison outlines a practical method using publicly available data. And because fake reviews systematically inflate the numbers you're parsing, it's worth knowing the signals that distinguish genuine reviews from staged feedback before drawing conclusions.
Don't Rely Solely on Third-Party Review Aggregators
Sites that aggregate star ratings across multiple retailers may be pooling scores from very different buyer populations, time periods, and even product variants. A score averaged across a retailer's marketplace listing, a direct brand site, and a specialty retailer can blend incompatible datasets. Always trace an aggregate score back to its component sources before treating it as definitive.
Cognitive shortcuts also shape how you interpret what you find. Anchoring to a competitor's high rating or falling for decoy pricing structures can bias your analysis before you've read a single review. The article on anchoring and decoy pricing biases explains how retailers construct comparison contexts to nudge choices in their favor.

Shopping Editorial Team
Shopping Editorial Team is the collective byline for our editorial team and contributor network. Articles published under this byline or an editorial pen name are researched, written, and reviewed according to our editorial standards for clarity, consistency, and independence before publication.
View author profile