
The Hidden Variables That Break Most Product Comparisons
Warranty terms, compatibility, and running costs are rarely on the comparison chart. Learn which overlooked factors change the outcome entirely.
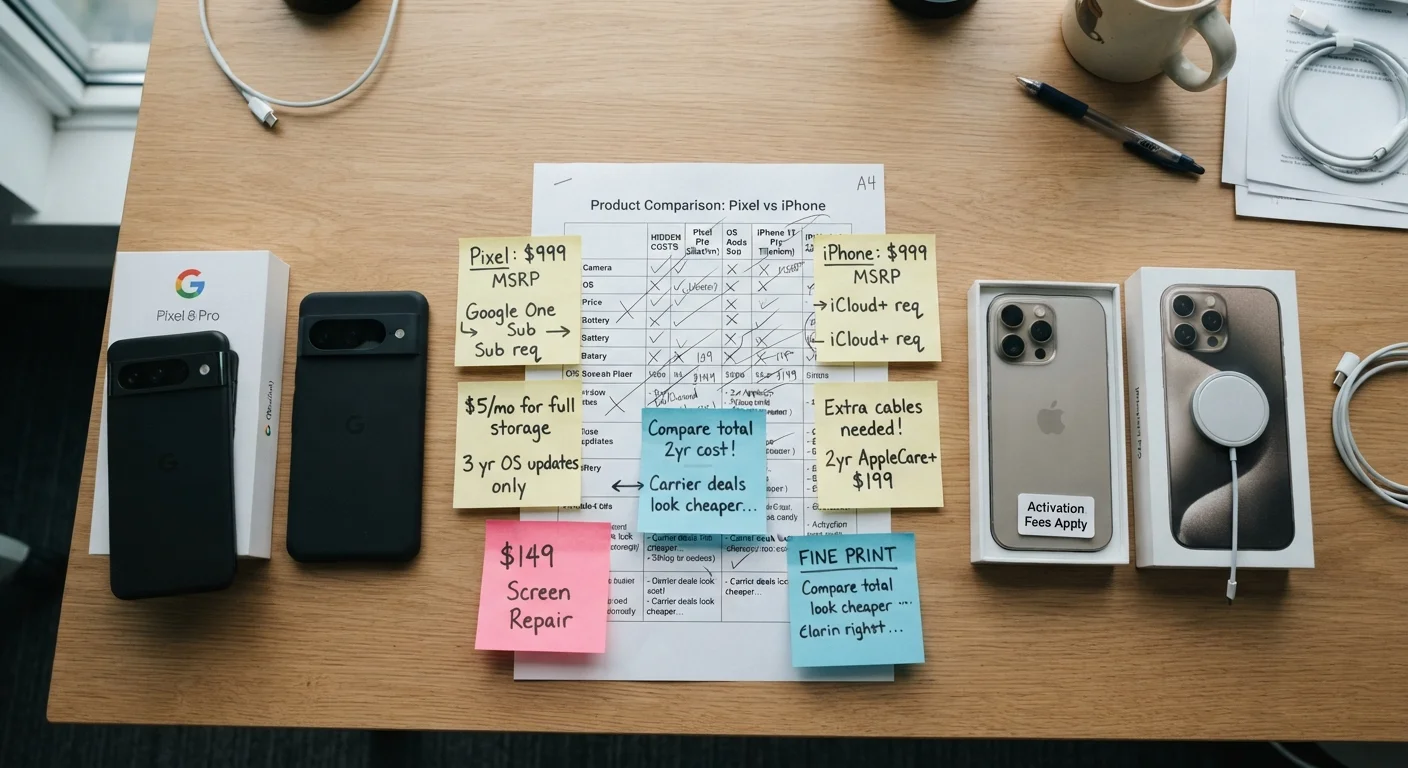
Photo: SummarizedReads.net | Just Read It! editorial
—— In This Article
Key Takeaways
- Sticker price is rarely the true cost — running costs and consumables often matter more.
- Compatibility gaps discovered after purchase are one of the most common and avoidable buyer regrets.
- Warranty length means little without understanding what the coverage actually includes or excludes.
- Most published comparison charts are built around available specs, not the variables that affect your experience.
- Clarifying your actual requirements before comparing options prevents most costly mismatches.
Why Standard Comparison Charts Fall Short
Most product comparison charts show what's easy to measure and easy to display: dimensions, weight, processor speed, megapixels. What they routinely omit are the variables that most directly affect whether a product works well for you — running costs, compatibility requirements, warranty coverage terms, and real-world performance under conditions that match your household or workflow.
This isn't an accident. Comparison frameworks are built around available data, and the data that's readily available tends to be what manufacturers choose to publish. That structural gap means even careful shoppers can reach the wrong conclusion through no fault of their own. The fix isn't to compare harder — it's to compare differently, starting with a clear baseline of your actual requirements before evaluating any option.
Total Cost of Ownership Changes Everything
A lower sticker price can easily become the more expensive option over a product's lifespan once energy consumption, replacement parts, and consumables are factored in. Before finalizing any comparison, calculate what each option costs to run, not just to buy. This single step reverses the outcome of many apparent bargains.
The Mistakes That Derail Most Product Comparisons
The errors below are consistent patterns — not unusual oversights. Each one has a structural cause that makes it easy to repeat, and a straightforward countermeasure that most comparison guides never mention.
Treating purchase price as the only meaningful cost variable.
Why it happens: Price is always visible and easy to compare; ongoing costs are scattered across user manuals, energy labels, and long-term owner reviews that most shoppers never consult.
Skipping compatibility checks until after the purchase decision is made.
Why it happens: Compatibility requirements aren't always listed prominently; shoppers often assume a product will work with their existing setup without verifying the specifics.
Using warranty length as a quality proxy without reading coverage terms.
Why it happens: A longer warranty sounds like more protection, and manufacturers highlight duration prominently because it's a simple, persuasive number.
Comparing specs that don't correspond to real-world use conditions.
Why it happens: Published specs are measured under controlled or optimal conditions. Shoppers reasonably assume a higher number means better performance in their situation.
Ignoring the decision-warping effect of how comparisons are framed or presented.
Why it happens: Comparison charts are often constructed by retailers or manufacturers who control which attributes appear and which are omitted, naturally favoring the option they want you to choose.
If your comparison involves services rather than physical goods, the methodology shifts further still — comparing services and products requires different criteria entirely.
Building a More Reliable Comparison
When no published review matches your specific setup or use case, the most reliable approach is to construct your own structured comparison using manufacturer documentation, independent test data, and verified owner reports. Building your own side-by-side comparison is more accessible than it sounds and consistently produces better-matched purchase decisions.
~80%
Buyers who report post-purchase regret due to compatibility issues
Consumer research consistently finds compatibility and integration failures among the leading drivers of product returns and buyer dissatisfaction across electronics categories.
2–4×
Lifetime cost multiplier beyond purchase price for major appliances
Energy and maintenance costs over a typical 10-year appliance lifespan can range from two to four times the original purchase price, depending on category and usage patterns.
For home appliances specifically — where running costs, installation constraints, and compatibility are all significant variables — the gap between spec-sheet comparisons and real-world outcomes tends to be widest. A practical example is cooktop selection: comparing induction, gas, and electric cooktops illustrates exactly how hidden variables like installation requirements and energy costs change the outcome. When in doubt, consult our product comparison glossary to make sure you're interpreting spec sheet terminology correctly before drawing any conclusions.

Shopping Editorial Team
Shopping Editorial Team is the collective byline for our editorial team and contributor network. Articles published under this byline or an editorial pen name are researched, written, and reviewed according to our editorial standards for clarity, consistency, and independence before publication.
View author profile