
Total Cost of Ownership: The Framework Every Smart Shopper Needs
Purchase price is just the beginning. Total cost of ownership accounts for running costs, maintenance, and lifespan — and often flips the decision.
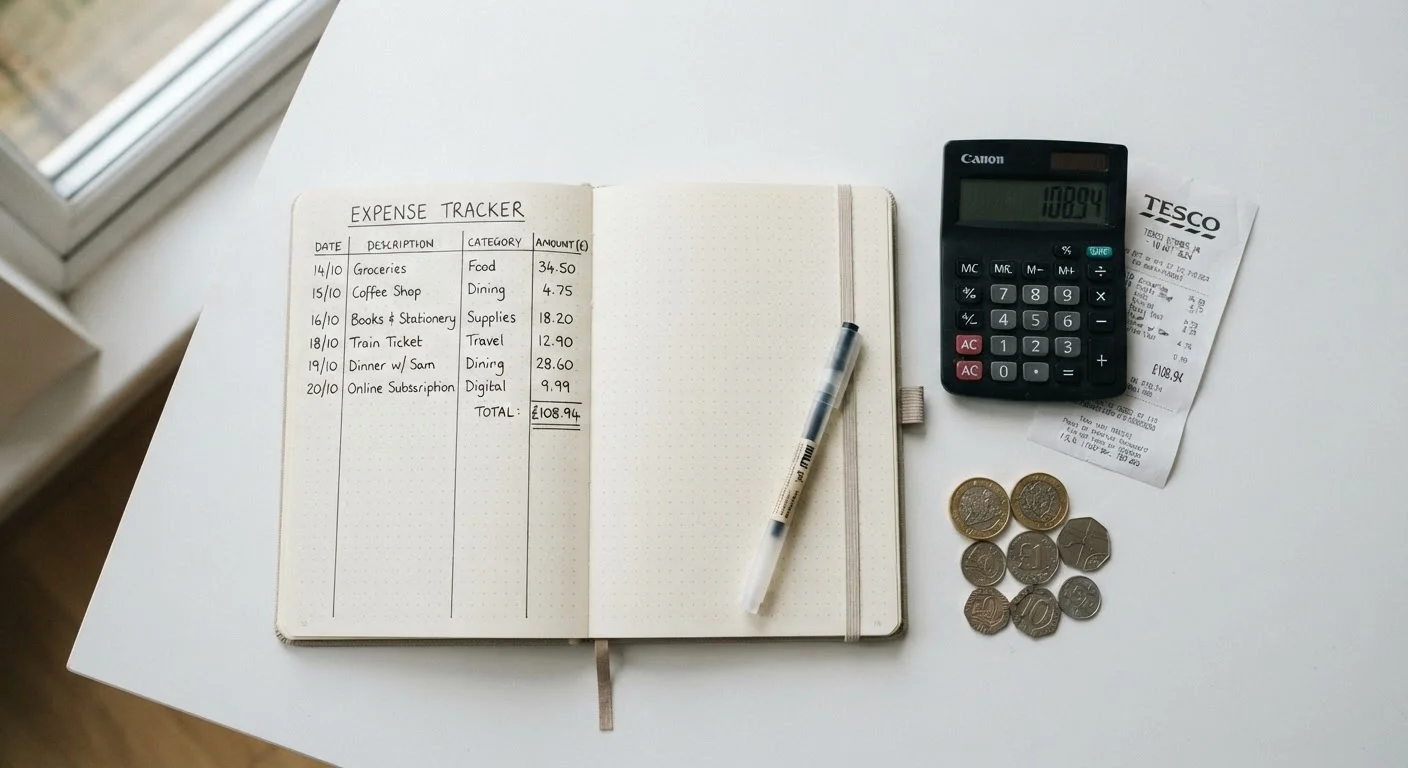
Photo: SummarizedReads.net | Just Read It! editorial
—— In This Article
Key Takeaways
- Purchase price typically represents only 30–60% of what a product actually costs over its lifetime.
- Four categories — acquisition, operating, maintenance, and disposal — cover nearly every hidden cost.
- TCO analysis often flips initial buying decisions when lifespan and running costs are properly accounted for.
- A simple spreadsheet comparison is enough to apply the framework to most everyday purchases.
- Financing a purchase adds an additional cost layer that sticker-price comparisons completely ignore.
What Is Total Cost of Ownership?
Total cost of ownership — commonly abbreviated as TCO — is a financial framework that calculates what a product or asset actually costs across its entire useful life, not just at the point of purchase. Originally developed for enterprise procurement decisions, it has become equally valuable for everyday consumer choices: appliances, vehicles, electronics, and even subscription services.
The concept is straightforward. When you see a price tag, you are seeing only the acquisition cost. TCO adds every downstream expense: energy or fuel consumption, consumables, maintenance, repairs, and eventually disposal or replacement. In many product categories, the purchase price accounts for less than half of what you will actually spend.
For shoppers who already compare reviews and specs online, TCO is the natural next step — the lens that reveals whether a lower sticker price is genuinely cheaper or just cheaper upfront. Our shopper's glossary includes a plain-language definition alongside other comparison terms you will encounter in product research.
30–60%
Typical share of TCO represented by purchase price
Industry procurement research consistently finds acquisition cost is a minority of lifetime product cost in durable goods categories.
$1,500+
Estimated average annual vehicle ownership cost beyond loan payment
AAA's annual 'Your Driving Costs' study tracks insurance, maintenance, fuel, and depreciation as separate cost layers for U.S. drivers.
10 years
Standard comparison lifespan for major appliances
The U.S. Department of Energy uses a 10-year window when calculating EnergyGuide estimated annual operating cost projections.
The Four Cost Categories Every Purchase Has
Regardless of what you are buying, TCO breaks down into four buckets. Understanding each one ensures nothing slips through the cracks.
1. Acquisition Cost
This is the purchase price plus any immediate extras: taxes, delivery fees, installation charges, and required accessories that do not come in the box. Financing arrangements belong here too — if you carry a balance, the interest paid is part of what the item actually costs you. The true cost of carrying a balance covers that math in detail.
2. Operating Cost
Recurring costs to use the product: electricity for appliances, fuel or charging costs for vehicles, data plans for connected devices, and subscription fees for software-dependent hardware. These compound over years and routinely exceed the purchase price in energy-intensive categories.
3. Maintenance and Repair Cost
Scheduled servicing, replacement parts, consumables (filters, ink cartridges, blades), and unscheduled repairs. Products with proprietary parts or specialized labor requirements carry materially higher maintenance costs than alternatives with open-market serviceability.
4. Disposal or Replacement Cost
At end of life, some products cost money to dispose of responsibly (electronics recycling fees, appliance haul-away charges). Others retain resale value that offsets future purchase costs. Factoring in residual value is especially important in vehicle and high-end electronics decisions.
Always calculate the annual cost per use, not just annual cost. A $500 item used daily for five years costs far less per use than a $200 item used weekly that lasts three years.
Normalizing cost against actual usage frequency exposes value differences that raw TCO totals can obscure, especially for tools and appliances with variable use patterns.
When researching maintenance costs, search owner forums rather than manufacturer websites — real-world repair frequency and parts costs are almost always higher than official estimates.
Manufacturers have commercial incentives to minimize perceived maintenance burden; independent owner communities report actual cost experiences without that bias.
Applying TCO in Real Buying Decisions
Abstract frameworks become useful when applied to concrete examples. Consider two illustrative scenarios — not specific products, but cost patterns that appear repeatedly across categories.
Appliances: Efficiency vs. Sticker Price
An appliance with a lower purchase price but higher annual energy consumption may cost significantly more over a 10-year lifespan than a more efficient model priced higher upfront. The U.S. Department of Energy's EnergyGuide labels provide estimated annual operating costs specifically to enable this comparison. Calculating the payback period — how many years of energy savings it takes to offset the price difference — determines which option delivers lower TCO for your usage pattern.
Vehicles: Where TCO Diverges Most Sharply
Vehicles are the category where TCO analysis has the most dramatic impact on decisions. Insurance, fuel, scheduled maintenance, registration, and depreciation can more than double the effective annual cost of ownership beyond the loan payment. The car buying process, explained step by step covers how to factor these costs into your initial budget before you ever set foot in a dealership. Our broader car buying tips hub also includes guidance on ownership cost planning.
Electronics and Subscriptions
Printers, gaming consoles, and smart home hubs often use a razor-and-blades pricing model: a low device cost subsidized by high consumable or subscription revenue. TCO analysis surfaces this immediately — a printer priced at $80 with $35-per-cartridge ink can cost hundreds annually in a high-use household.
Promotional Pricing Can Distort TCO Calculations
A sale price or promotional discount applies only to the acquisition cost — it has no effect on operating or maintenance expenses. A 20% discount on a high-TCO product may still leave it more expensive over time than a full-priced alternative with lower running costs. Always apply discounts to the acquisition cost column only, then recalculate total TCO before deciding.
Common Mistakes That Inflate Hidden Costs
Even shoppers who intend to apply TCO thinking make predictable errors that undermine the analysis.
- Using manufacturer lifespan estimates uncritically. Actual product longevity under real-world conditions often differs from rated lifespan. Independent reliability databases and owner forums provide more accurate durability data.
- Ignoring usage rate. A fuel cost estimate based on average driving means nothing if your actual commute is twice the national average. Calibrate operating cost estimates to your specific usage.
- Omitting opportunity cost. Money spent on a higher upfront TCO option is money not invested elsewhere. For large purchases, the opportunity cost of capital is a legitimate TCO input, even if it is harder to quantify.
- Forgetting behavioral costs. Some products require your time as well as your money — time spent on maintenance, troubleshooting, or workarounds. Time has value; products that demand more of it carry a real cost that never appears on a spec sheet.
Pairing TCO analysis with structured purchasing habits reduces regret significantly. The habit framework for avoiding buyer's remorse is a practical complement to the numbers-based approach here.
Building Your Own TCO Comparison
You do not need specialized software to apply TCO analysis. A straightforward spreadsheet with five columns — option name, acquisition cost, annual operating cost, annual maintenance estimate, and expected lifespan in years — is sufficient for most decisions.
The formula is simple: TCO = Acquisition Cost + (Annual Operating Cost × Years) + (Annual Maintenance × Years) − Residual Value. Run this for each option under consideration, using the same lifespan assumption across all of them so the comparison is apples-to-apples.
For the operating cost inputs, look for third-party data sources rather than manufacturer claims: utility rate calculators, published owner cost surveys, or aggregated repair frequency data. For maintenance, service manual intervals and local labor rates give reasonable estimates.
Once you have your TCO figures, divide each by lifespan to get an annualized cost. That number — cost per year — is the most useful single metric for comparing options with different useful lives.
This kind of deliberate, structured analysis sits at the core of low-regret spending habits — and it pairs directly with the broader shopping tips strategies that help budget-conscious consumers stretch every dollar further. The deals and coupons landscape is also worth understanding, since a promotional price on a high-TCO product may still be the worse financial choice.
Start With Your Highest-Cost Categories
Don't apply TCO analysis to every purchase — the effort isn't always worth it for low-cost items. Reserve the full framework for decisions where the purchase price exceeds roughly $200 or where you expect ongoing operating costs. Vehicles, major appliances, HVAC systems, and electronics with consumables or subscriptions are the categories where TCO analysis consistently changes decisions.

Shopping Editorial Team
Shopping Editorial Team is the collective byline for our editorial team and contributor network. Articles published under this byline or an editorial pen name are researched, written, and reviewed according to our editorial standards for clarity, consistency, and independence before publication.
View author profile